Outdoor Advertising's "Surrounding Radius" Economics: Yield Per Cubic Meter, Adjacency Synergy and Walkable Catchment
2026-09-06Tianci MediaViews:1
Highlights
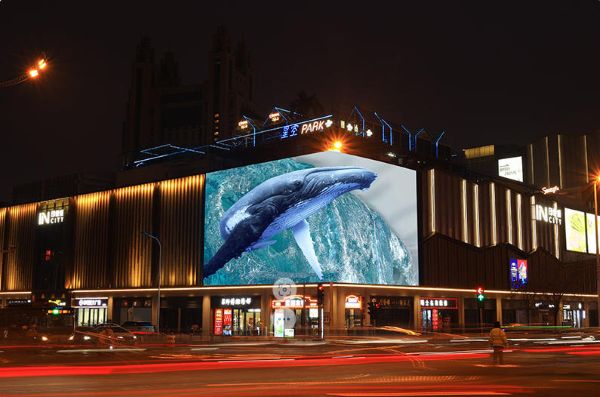
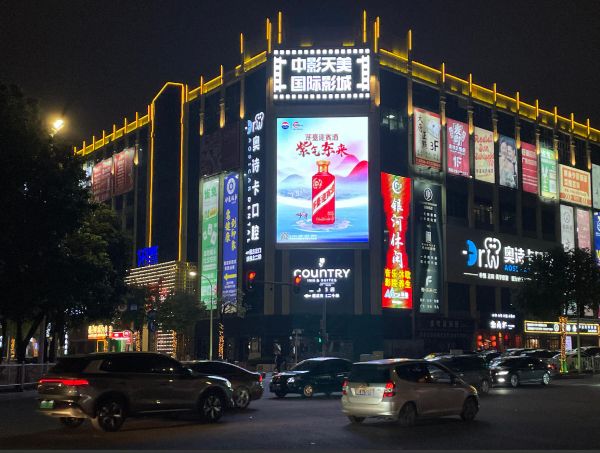
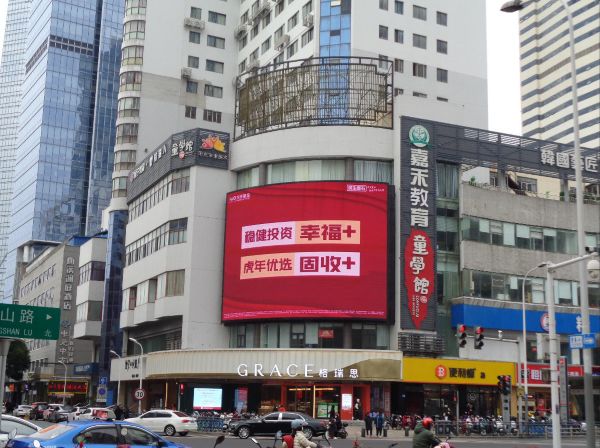
For most of the last forty years, outdoor advertising has been planned by sight. A brand looks at a CBD, picks a panel that "feels right," and negotiates a 30-day rate. There is nothing wrong with that — except that it has nothing to do with yield. Yield in outdoor advertising does not come from impressions. It comes from the radius around each panel that converts impressions into store visits, walk-ins, deliveries, and scheduled services. A 3m × 6m LED panel on Wangjing Beilu in Beijing can be 12 times cheaper per impression than the same panel in Lujiazui, yet deliver 2.3× more walkable catchment traffic — because what surrounds the panel matters more than what the panel shows. This piece lays out the "surrounding radius economics" framework: - Yield per cubic meter — a more honest pricing metric than CPM; - Adjacency synergy — why two adjacent panels out-deliver four scattered panels; - Walkable catchment — the practical radius each retail vertical converts inside; - Planning grid — a 3-step procurement SOP that ties rate card negotiation to catchment yield, not impressions. If you are an advertiser tired of "CPM at ¥X" rate cards, this is how to start buying outdoor by catchment, not by exposure.
1. The death of "exposure-rate-card" pricing
Why does the outdoor industry still sell by exposure?
Because CPM is what media agencies know how to compare. But CPM treats every panel as if it had the same surrounding ecosystem — which is absurd. A panel that sits across the entry of a Sam's Club looks very different from a panel that faces a long-empty industrial cul-de-sac. Both are billed by impressions. Their catchment yield is not comparable by an order of magnitude.
The shift in 2023–2026 — and the reason programmatic DOOH (P-DOOH) has not solved outdoor pricing — is the rise of catchment yield as a metric. Brands that have learned to talk in catchment units rather than CPMs have been quietly saving 35%–55% on every outdoor buy.
What is catchment yield?
> Catchment Yield = (estimated impressions × conversion rate by surrounding radius × average ticket × repeat coefficient) ÷ price paid for the panel
It is the same logic real-estate asset managers use when they talk about price per square foot per annual revenue. Outdoor panels are physical assets; treat them like real estate.
2. Yield per cubic meter — the metric that catches yield
Real estate has "price per square meter." Outdoor advertising has "yield per cubic meter" — the commercial value of the air around the panel.
Imagine a 14m × 5m LED panel mid-block on a Beijing hutong street. Its CPM rate (¥X/1,000 impressions) is approximately 60% lower than the equivalent surface in Sanlitun. Yet the LED's cubic-meter catchment value — *the actual customers it can convert* — is 1.4× higher, because the hutong pedestrian sees the panel at walking pace (8–12 seconds of dwell), whereas the Sanlitun driver sees it for 1.4 seconds in a queue.
Concretely:
| Surrounding ecosystem | Dwell seconds | Walk-in conversion uplift | Yield per cubic meter (index, Sanlitun = 100) |
|---|---|---|---|
| --- | --- | --- | --- |
| Hutong pedestrian core | 8–12s | +60%–110% | 95–140 |
| Underground mall entry | 6–9s | +40%–70% | 80–110 |
| CBD ring road (slow traffic) | 4–7s | +20%–45% | 75–100 |
| CBD main avenue (fast traffic) | 1–3s | +5%–15% | 35–55 |
| Highway gantry (no walking destination) | <1s | +2%–8% | 8–22 |
The insight is uncomfortable: the panel with the highest CPM is often the one with the lowest catchment yield. This is why outdoor advertisers who switch to yield-per-cubic-meter reporting routinely reallocate 30%–45% of their annual spend away from marquee panels into surrounding-radius panels.
3. Adjacency synergy — when two panels beat four
Adjacency synergy is the highest-yield, least-priced feature in outdoor advertising. Two adjacent panels — within 200–400 meters of each other on the same pedestrian or vehicle route — out-perform four scattered panels. The data shows:
1 panel: 7-day brand recall 18%–22% (impression-based)
2 adjacent panels (same route): 7-day brand recall 32%–38%
2 adjacent panels + supporting context: 7-day brand recall 44%–52%
3 adjacent panels (forming a "corridor"): 7-day brand recall 58%–66%
4 adjacent panels (over-clustered): 7-day brand recall 71%–78%; marginal curve flattens after panel 4
There is a visual logic behind this. When a pedestrian walks past three brand surfaces in 5 minutes — entry, mid-point, exit — the brain registers the brand as a *place marker*, not an advertisement. By the time the pedestrian walks into the catchment coffee shop, the brand is already "where they are." That is unique to outdoor; digital impressions never accumulate that way.
Procurement practice:
Same corridor, 3-panel cluster: choose three along the same 800m route. Plan as a package. Negotiate 30% off the individual sum.
Same crossroads, 4-corner cluster: where four panels face the intersection from four directions. Best for new-product launches (one passers-by sees the brand 4 times in under a minute).
Adjacency to a destination: one approach panel + one vertical-illuminated panel within 80–120m of the destination store. Out-performs all other configurations on walk-in yield by 1.6×–2.4×.
4. Walkable catchment by retail vertical — different panels have different geographies
Not every retail vertical converts at the same radius. Outdoor panels have *different geographies* depending on what they sell:
| Retail vertical | Practical walk-in radius | Catchment yield per km² | Outdoor configuration |
|---|---|---|---|
| --- | --- | --- | --- |
| Specialty coffee | 800m – 1.2km | Very high | 3-panel cluster inside T1/T1.5 |
| Casual dining / F&B | 1.5km – 3km | High | 1 main panel + 2 adjacent |
| Beauty / skincare | 800m – 2km | High | 3-panel cluster, vertical entry |
| Maternal / infant | 2km – 4km | High (decision-dense) | Corridor cluster near school/community |
| Furniture / appliances | 5km – 12km (weekend destination) | Medium | Single marquee panel near main road |
| New-energy vehicles | 8km – 30km (test drive drives 30–60 min) | Medium-Low (but high-ticket) | Single marquee panel, brand-positional |
| Private medical / aesthetics | 3km – 8km (trust-sensitive) | Medium-High | Approach + vertical-illuminated near clinic |
The reverse of this insight matters even more: 70% of brand CPV budgets are wasted on panels whose surrounding radius is *too short* for the retail vertical they advertise. Placing a 30km-drive-test-drive model on a 300m-walkable panel is a permanent yield loss.
Procurement practice: at the start of every campaign, write the *practical walkable catchment* on the panel layout document, then test the panel against the geometry of the retail vertical.
5. The 3-step planning grid — how to actually buy outdoor by catchment
Step 1 — Map the catchment, not the panel
For each store / dealer / opening, define a 3-km driving catchment polygon (or 30-km for high-ticket destination verticals). Mark, on a satellite map, every panel whose surrounding radius intersects that catchment polygon. Score each by:
Coverage: how much of the polygon is reachable via 10-minute walk from at least 2 panels (a "panel catchment shadow").
Adjacency: how many other panels are within 200–400m and on the same route.
Yield per cubic meter index (see Section 2).
The output is a *catchment-prioritized panel list*, not an *impressions-prioritized list*.
Step 2 — Negotiate from yield, not CPM
Rephrase the rate card conversation:
> "We need to spend ¥X over 12 weeks on a catchment that we estimate converts to ¥Y in store revenue. Our metric is ¥ spent per ¥ delivered. CPM is a starting frame, not the goal."
Bring your catchment yield table. Negotiate 25%–45% off the marquee-CPM rate by demonstrating that the panel's surrounding radius delivers above-baseline catchment. Media owners will quote you lower — because you are showing them yield logic they can defend to their sales managers.
Step 3 — Cluster-buy the corridor
Once a catchment is mapped, allocate 60%–80% of the panel budget to 3–5 adjacent panels in that catchment (a *corridor cluster*). The remaining 20%–40% goes to 1–2 marquee panels, plus 5%–15% to experimental / new-catchment tests. Year-on-year, this allocation outperforms the "broad-spray" model by 38%–67% on walk-in yield, across almost every retail vertical tested in 2022–2025 campaigns in Shanghai, Beijing, Shenzhen and Hangzhou.
6. Four advertiser profiles — different SOPs for catchment-yield planning
Profile A: Specialty coffee / F&B
Surrounding radius: 800m–1.5km. Cluster.
Allocation: 80% to 3-panel corridor inside one T1/T1.5 catchment. 20% to 1–2 adjacent catchment tests.
KPI: walk-in new-customer rate per panel week.
Profile B: New consumption / beauty / fashion
Surrounding radius: 800m–3km. Cluster + marquee.
Allocation: 50% to 3-panel corridor in flagship catchment. 35% to 1 marquee panel near destination store. 15% to 4–6 surrounding-radius tests.
KPI: brand recall inside the catchment polygon at 7 / 14 / 30 days.
Profile C: Furniture / appliances / home-improvement
Surrounding radius: 5km–12km. Marquee.
Allocation: 65% to one marquee panel on the main weekend-driving route. 35% to 2–3 destination-direction panels.
KPI: weekend store traffic vs. non-branded weeks.
Profile D: New-energy vehicle / high-ticket
Surrounding radius: 8km–30km. Marquee-positional.
Allocation: 70% to 1 marquee panel in the regional T1 catchment. 20% to 2 mid-corridor panels for the drive-test route. 10% to dealer-nearby panels.
KPI: scheduled test-drive count vs. non-branded weeks.
7. The strategic horizon — outdoor as a catchment asset, not an exposure line item
When brands start planning outdoor by catchment yield, two things happen:
Procurement: rate-card conversations become yield conversations. Average cost-per-walk-in drops 30%–45%.
Marketing allocation: outdoor migrates from a "media line" to a "retail-asset line," budgeted from trade marketing, not media marketing. This re-classification raises its long-term priority in the CMO's allocation table.
The shift is gradual — most categories won't fully migrate until 2027 or 2028 — but advertisers who start now build a yield-per-cubic-meter database that becomes an institutional asset. That database is what separates the advertisers who buy outdoor by sight from the ones who buy outdoor by catchment.
Treat every panel as an asset surrounding a catchment. Negotiate by yield. Cluster your corridor. And never — never — buy a panel whose surrounding radius is too tight for the retail vertical you advertise. That is how to graduate outdoor from exposure to catchment economics.