Airplane Advertising ROI: How to Track & Maximize Your Campaign Results
2026-06-14Tianci MediaViews:27
Highlights
Airplane advertising delivers massive exposure, but how do you measure its return on investment (ROI)? Unlike digital ads with instant clicks, aerial campaigns require a different measurement approach. This guide covers five actionable metrics to track your success.
1. Ground Impressions (External Wraps)
Count how many people see your fuselage wrap.
Formula: Daily airport passengers × number of daily departures × days active.
Example: A regional jet at an airport with 50,000 daily passengers, making 6 departures per day for 30 days = 9 million ground impressions.
Benchmark: $3–$7 CPM (cost per thousand impressions) is competitive with billboards.
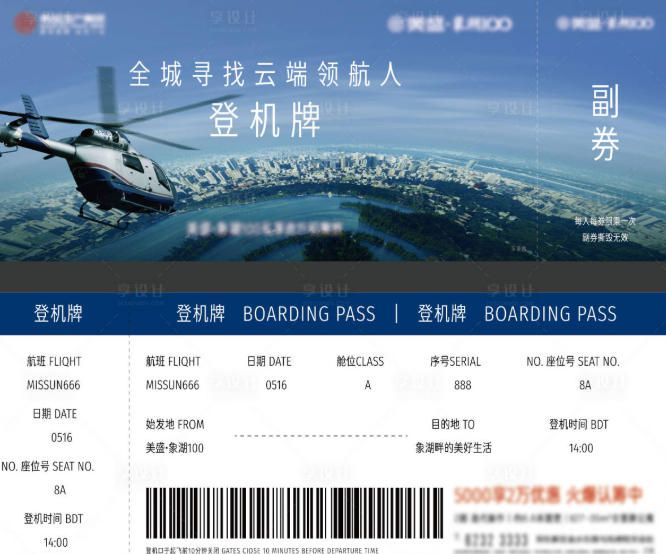
2. QR Scan Rate (Tray Tables / Boarding Passes)
Your most direct response metric.
Formula: (Number of QR scans ÷ total passengers on that route) × 100.
Benchmark: 2–5% scan rate is strong. Top campaigns reach 8–12% with a compelling offer (free Wi‑Fi, lounge access, or discount).
3. Short URL Clicks
Use a campaign‑specific link (e.g., brand.com/fly).
Track via any URL shortener or analytics tool. Compare traffic from campaign period to baseline.
Benchmark: A 15–25% lift in traffic from target cities or airports indicates success.
4. Brand Lift Recall
Measure via post‑flight survey (onboard Wi‑Fi or email).
Ask: “Which brands do you remember seeing on your flight?” Include your brand and 2–3 decoys.
Benchmark: 15+ percentage point lift over control route (no ads) is excellent.
5. Cost Per Result (CPR)
Divide total campaign cost by desired outcome (store visit, booking, sign‑up).
Example: $18,000 campaign generated 500 incremental bookings = $36 CPR.
Compare to other channels (paid social, search, OOH) to determine if airplane ads are efficient.
Quick ROI Formula
(Total value generated – Campaign cost) ÷ Campaign cost × 100 = ROI%
If value is hard to assign directly, use cost per thousand (CPM) or cost per engaged user as proxy.
Pro Tips for Higher ROI
Combine external + internal: Fuselage wrap drives awareness; tray table QR drives action. Together they outperform either alone.
Target peak travel times: Holiday weekends, summer, and Lunar New Year deliver 2–3x more passengers.
Test before scaling: Run a 4‑week tray table test on one route. Measure scan rate and CPR. If positive, expand to more planes or add fuselage wrap.
Negotiate flight guarantees: Pay only for actual block hours (wheels up to wheels down), not parked time.
Conclusion
Airplane advertising ROI is measurable — if you set up tracking before launch. Use QR codes, short URLs, surveys, and ground impression math. Start small, test formats, and scale what works. The sky is not a blind spot; it’s a trackable channel.
Ready to calculate your potential ROI? Contact Tianci media for route‑specific impression estimates and a custom measurement plan.